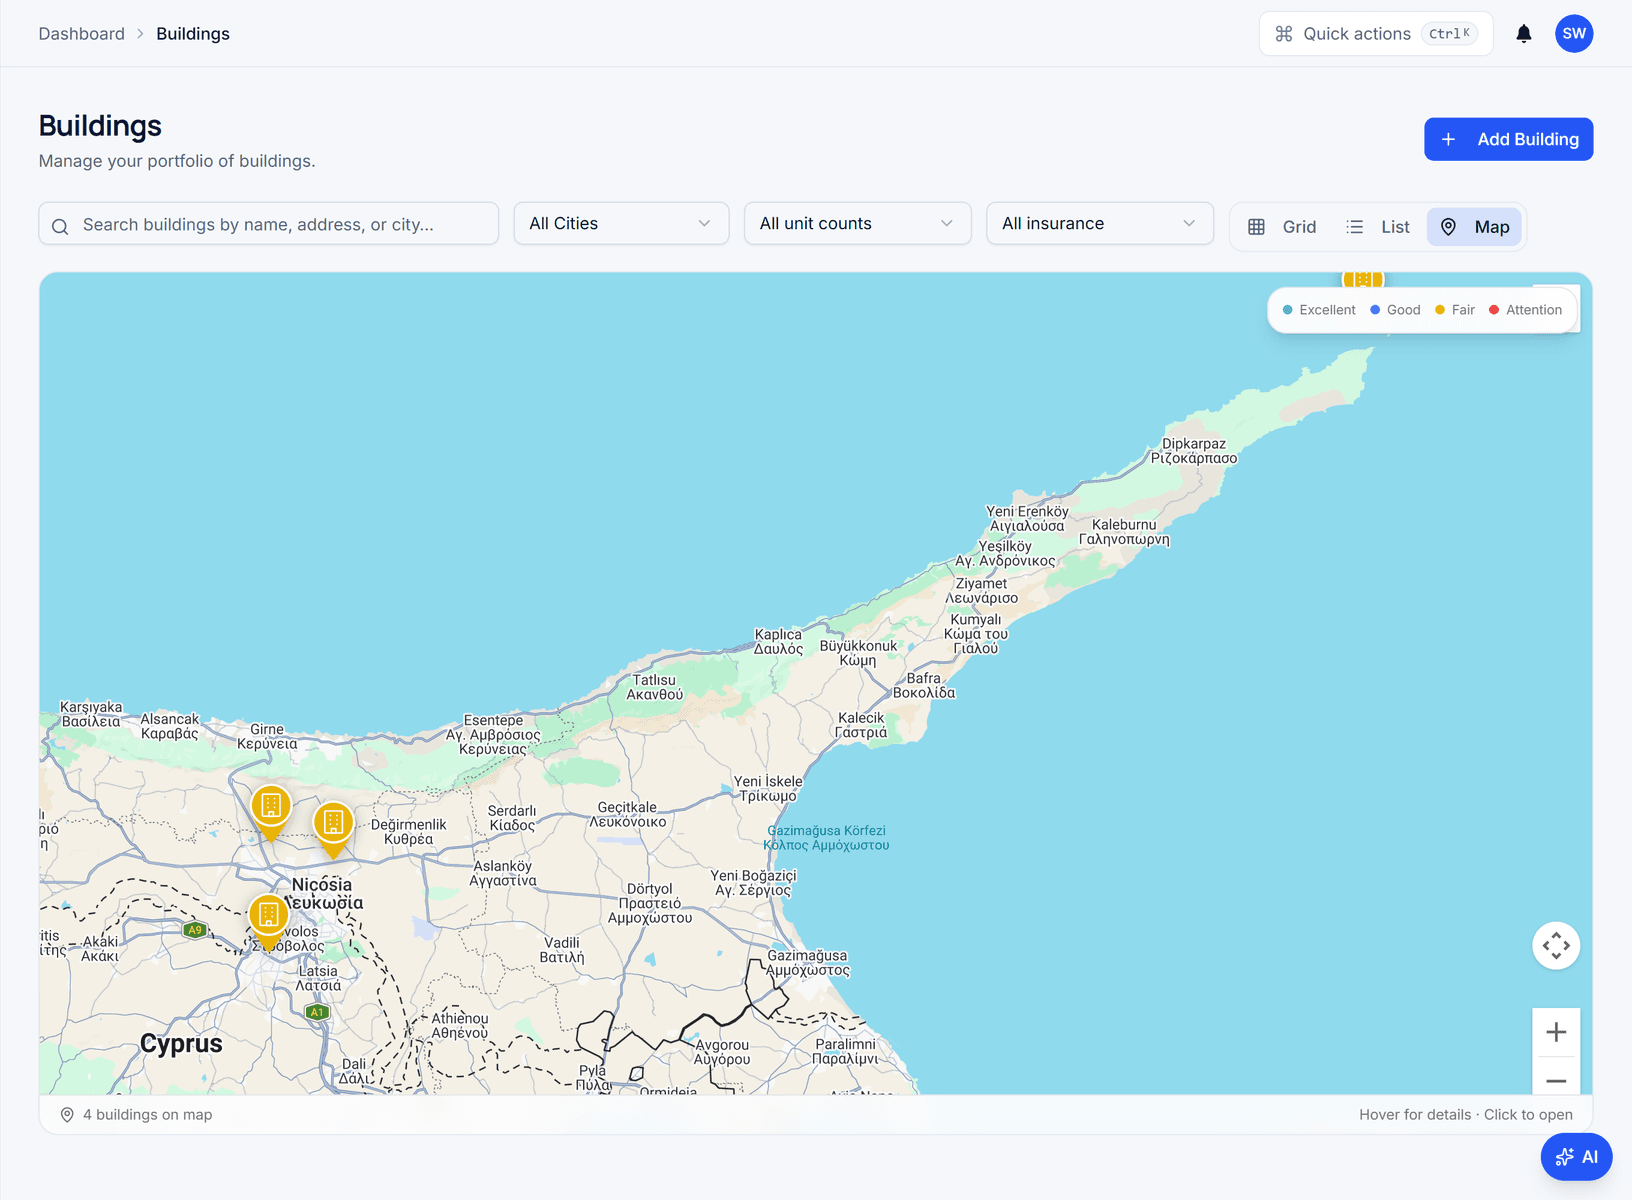
Your buildings on a map, coloured by health

Portfolio map & building health visibility

See every building on a map, coloured by health status, and open its operations from the marker.

https://domera.cy/dashboard/buildings
Buildings grid with health score and collection rate on each card and a Grid / List / Map switch above

Outcome

Marker colour follows the same health score as the buildings list, so the map and the list never disagree.

In practice

Why teams use this feature

What managers and committees tell us it changes in the monthly routine.

  • Pins coloured by health band

  • Filters by city, unit count and insurance status

  • Hover for details, click to open the building

  • Markers coloured by health status

  • Health status and collection rate per building

  • Address search and map picker when onboarding a building

  • One click from marker to the building's dashboard

How it works

What this feature does

Switch the buildings list to Map and every building appears as a pin coloured by its health band — excellent, good, fair, attention. Hover for the name, score and collection rate; click to open the building. Filter by city, unit count or insurance status. The same score sits on the grid cards, so the map is a change of lens, not of data.

01

Where are the buildings that need attention?

On the map, in amber and red. Each pin takes the colour of the building's health band: 90 and above excellent, 75 to 89 good, 50 to 74 fair, below 50 attention. Four buildings across Nicosia are four pins; a portfolio across Limassol, Athens and Berlin is the same map, zoomed out. Pins are placed from the address and map location captured when the building was added.

02

What a pin tells you before you click

Hover: building name, health score, collection rate. The legend at the top right names the four bands. The counter at the bottom shows how many buildings are on the map after your filters — city, unit count, insurance status. Click to open the building's overview with its common and reserve fund cards.

03

Why the map shows the same number as the card

There is one health score per building, computed from six signals — collection rate, outstanding balance, draft expenses, overdue tasks, insurance status, compliance — and the grid, the list, the map and the Action centre all read it. Record the overdue lift inspection and the pin changes colour on the next load. No separate map data is maintained.

04

Who sees which pins

An admin sees every building in the company; a manager sees the buildings assigned to them through building membership, so their map is their portfolio. Owners do not see the map; their portal shows their own building. Filters change the view, not the data.

In the product

See it on the screen

https://domera.cy/dashboard

Interface shown is from an earlier version

Where the map leads

Dashboard overview with portfolio cards, the Action centre and recent activity

Related

Keep exploring

  • AI building assistant

    Ask about any building, owner or balance in plain language; the Domera assistant answers from your company's own records.

    Learn more
  • Smart allocation engine

    Allocate every common expense by ownership share, floor area, equal parts, floor level, lift share or a custom rule.

    Learn more
  • Owner portal transparency

    Owners sign in and read their own units' statements, balances, payments, documents, compliance status and meetings.

    Learn more

FAQ

Frequently asked questions

More answers on the full FAQ page.

Is the map only a visual layer, or can teams act from it?
Click a pin and the building opens on its overview, from which expenses, payments, tasks and compliance are one tab away. The map is a way into the building, not a separate report.
Can we see both health and collection context?
Yes. The pin colour is the health band and the hover card shows the score and the collection rate, the same figures as the building card.
Does this help multi-city portfolios?
The map shows every building the user may see, in any country, and filters by city. Addresses are geocoded from the building's address at onboarding.

Start with one building

Ready to put the building's books in order?

Start the 14-day trial, add the first building and run one month through it. Import the owners, post the invoices, issue the statements.

  • 14-day free trial
  • No credit card required
  • Cancel any time